Introducing DeepSee Visual Reporting
DeepSee Visual Reporting is a graphical user interface to Zen reports, which allows you to create reports from data stored in the Caché database. It consists of a suite of web-based tools including graphical query generators and layout editors. It uses the same core engine as Zen reports and is built on top of the existing Zen reports architecture. The GUI makes the report authoring process easier, and hides much of the complexity of the underlying technology.
Creating a report in DeepSee Visual Reporting is a three-step process:
-
The first step is to specify the data set that drives the report, and to specify how it should be sorted and grouped.
-
The next step is to specify how the data should be formatted for presentation in the report. The graphical UI and editing tools help you visualize and fine tune the report output.
-
The final step is to run the report. At this point, you supply values for query parameters, and generate the PDF file.
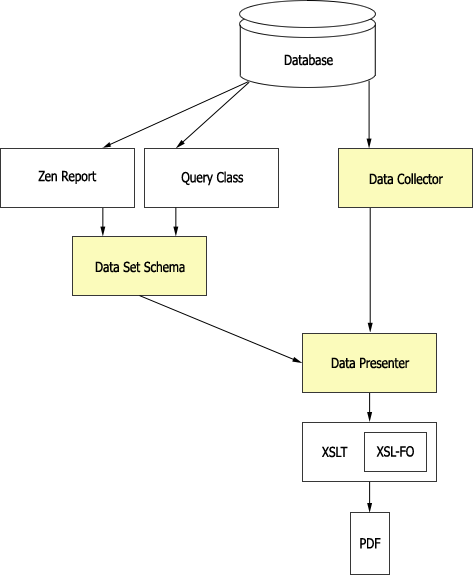
The following figure presents an overview of report production with DeepSee Visual Reporting. Colored blocks indicate DeepSee Visual Reporting classes. In the data specification step, you can use a Data Collector to draw data for the report directly from persistent classes, or you can create a Data Set Schema to use existing Zen reports or query classes. Then you build a Data Presenter, which specifies layout and appearance. The final step uses the Data Presenter to generate PDF output.
Additional Reading
For a more detailed understanding of Zen reports, see Using Zen Reports. For information on using the Management Portal, see the chapter “Using the Management Portal” in the book Caché System Administration Guide.
Tutorials
DeepSee Visual Reporting Overview
The following exercise uses DeepSee Visual Reporting to create and run a simple report. If you have a new Caché installation, before you begin this exercise you must first run the ZENDemo home page. Loading this page silently generates data records for the SAMPLES namespace. You only need to do this once per Caché installation.
Enter the following URI in the browser:
http://localhost:57772/csp/samples/ZENDemo.Home.clsOpens in a new tab
Where 57772 is the Web server port number that you have assigned to Caché.
Now begin the exercise as follows:
-
Initial set-up:
-
Click the InterSystems Launcher and then click Management Portal.
Depending on your security, you may be prompted to log in with a Caché username and password.
-
Switch to the SAMPLES namespace as follows:
-
Click Switch.
-
Click SAMPLES.
-
Click OK.
-
-
-
Building the Data Collector:
-
Click DeepSee, Visual Reporting, Report Data Definition, and then Data Collection Builder.
-
Click New. The system displays a dialog box where you enter the following values:
-
Package Name — MyApp
-
Class Name — TheaterDC
-
-
Click OK. The page shows the default Data Fields runTime and runBy.
-
At the top of the Data Source column, click Change. The system displays a dialog box. Select Cinema.TheaterOpens in a new tab.
The page now displays a default data structure for the persistent class Cinema.TheaterOpens in a new tab.
-
Click Save.
-
This page provides tools to refine the data structure of the report. That process is discussed in section “Editing the Report Content.” For now, use the default data structure.
-
-
Building the Data Presenter:
-
Click DeepSee, Visual Reporting, Report Builder and then Line Item Report Builder.
-
Click New. The system displays a dialog box where you can enter the following values:
-
Package Name — MyApp
-
Class Name — TheaterReport
-
-
Click OK.
-
At the top of the Fields column, click Set source. The system displays a dialog box. Select the Data Collector you created previously, by clicking MyApp, then TheaterDC.
-
The page now displays an empty report, with areas where you can define the main sections of a Zen report:
-
Define Report Header
-
Define Page Header
-
Report Body (query result)
-
Define Report Footer
-
Define Page Footer
-
-
At the top of the Fields column, click Auto-fill. The system fills in the report with a default set of labels and fields according to a format defined in a default report template.
-
Click Save.
-
Click Preview to view the default report.
This page provides a number of editing features you can use to refine the layout and appearance of the report. That process is discussed in the section “Editing the Report Layout”.
-
-
Running the Report:
-
Click DeepSee, Visual Reporting, and then Run Reports.
-
Click Open. The system displays a dialog box where you can select a report. Click MyApp, then TheaterReport. The page updates to show the Data Collector for this report. In this example, that is MyApp.TheaterDC.
-
Click Run. After a brief pause, PDF output appears in the browser window.
-
Using Zen Reports and Query Classes
DeepSee Visual Reporting also allows you to use existing Zen reports and query classes as the basis for new reports. The following exercise shows you how to use these alternative ways of defining the data structure of a report.
-
From an existing Zen report:
-
Click DeepSee, Visual Reporting, Report Data Definition, and then Extract from legacy report.
-
Click New. The system displays a dialog box where you can enter the following values:
-
Package Name — MyApp
-
Class Name — ExtractMyReport
-
-
Click OK. The page updates to show Data Source and Data Projection columns.
-
At the top of the Data Source column, click Change. The system displays a dialog box. Select ZENApp.MyReportOpens in a new tab. The page updates to show the structure of the report definition. You do not have tools to reorganize the report on this page, because the data structure is determined by the original Zen report.
-
Click Save.
-
-
From a query class
-
Click DeepSee, Visual Reporting, Report Data Definition, and then Build from query.
-
Click New. The system displays a dialog box where you can enter the following values:
-
Package Name — MyApp
-
Class Name — BuildQueryFilms
-
-
Click OK. The page updates to show Data Source and Data Projection columns.
-
At the top of the Data Source column, click Change. The system displays a dialog box. Select Cinema.Film_TopFilms. The page updates to show the default structure of the report.
-
Click Save.
-
You can use this page to refine the data structure of the report. That process is discussed in section “Editing the Report Content.”
-
From this point, you can go on to define the data presentation and run the report as described in the steps “Building the Data Presenter” and “Running the Report” in the section “DeepSee Visual Reporting Overview.”