Monitoring Activity Volume
The Activity Volume Statistics and Monitoring package provides short-term monitoring of system performance and long-term reporting on message traffic.
This chapter contains:
Activity Monitoring Overview
Activity monitoring can be useful for tasks such as:
-
Monitoring the system health—Using the dashboard provides a quick window into your Ensemble system performance. If the message duration or queue size is growing, it may indicate a performance issue.
-
Trouble shooting problems—Using the dashboard can help diagnose a current or past problem. You can use it to determine if a specific configuration component was the primary cause of a performance bottleneck.
-
Tracking performance and activity growth to aid in capacity planning—By reviewing long-term changes in message volume you may be able to estimate future growth. You can plan for increased capacity before encountering a significant performance issue.
The Activity Monitoring package provides:
-
A centralized store for message statistics.
-
A data model that makes it easy to analyze and report on the statistics using SQL or DeepSee.
-
DeepSee dashboard showing message current message rates and response times for each interface.
-
Variable granularity for long term and short term statistics.
-
Long term storage of message statistics available for historic reporting.
-
Custom statistic collection using application specific metrics.
This package stores summary statistics that contain information such as the number of messages that pass through a configuration component and the average time to process the message. This summary information is stored in a compact, efficient manner and can be maintained over very long periods of time without requiring extensive amounts of storage.
The monitor provided with this feature allows you to display the current data over several different time periods. But the statistics stored in the database provide a richer set of data. You can use the analysis and reporting tools of your choice to analyze long-term trends or to compare the volume trends during peak traffic times. This capability allows you to analyze and troubleshoot problems with overloaded components and to track long-term load changes so that you can provide additional resources before problems develop.
All classes that inherit from Ens.BusinessServiceOpens in a new tab, Ens.BusinessProcessOpens in a new tab, or Ens.BusinessOperationOpens in a new tab can use the built-in activity monitoring. In addition, you can use custom code to include custom data in your activity monitoring.
The Activity Volume Statistics and Monitoring package allows you to monitor multiple namespaces running on a single instance of Ensemble and collect the statistics from these namespaces in a single database.
The DeepSee dashboard user interface supports the ability to display statistics from multiple instances of Ensemble, but the mechanism to gather statistics from multiple instances is experimental and should not be used in production environments.
Enabling Activity Monitoring
You can monitor activity for a single namespace or for multiple namespaces that are running on the same instance of Ensemble. To enable activity monitoring, follow this procedure:
-
For each namespace that you want to monitor:
-
Add the Ens.Activity.Operation.Local business operation to the production in the namespace.
-
Configure the operation so that it specifies the namespace in which you will be collecting the statistics.
-
Enable the operation.
-
To enable statistics collection for all configuration items in the production, call the EnableStatsForProduction()Opens in a new tab method or, to enable statistics collection for individual configuration items, call the EnableStatsForConfig()Opens in a new tab method. For example, to enable statistics collection for all production configuration items in the ENSDEMO namespace, enter the following in the Terminal:
zn "ENSDEMO"
do ##class(Ens.Util.Statistics).EnableStatsForProduction()
-
-
If your business service calls SendRequest methods directly, you must add the statistics recording APIs as described in Writing Custom Code to Record Activity. If your business service uses OnProcessInput, you can skip this step.
-
Create or select an existing Ensemble namespace to use for data collecting. If you are only collecting activity data from a single namespace, you can select that namespace to collect the data or you can create a new one. If you are collecting data from multiple namespaces, we recommend that you create a new namespace and only use it for collecting the statistics.
-
Make it possible to use DeepSee to access to the data by enabling DeepSee in the namespace’s default web application. To do this:
-
Select System Administration > Security > Applications > Web Applications.
-
Select the default web application for the namespace. For example, if the namespace is WATCHACTIVITY, the default web application is typically /csp/watchactivity.
-
Select the DeepSee check box.
-
Select Save.
-
Using the Activity Monitor Dashboard
The Activity Monitor Dashboard is a DeepSee dashboard that displays the activity statistics. To go to the dashboard, ensure that you are in the namespace being used to collect statistics and select Ensemble > Monitor > Activity Volume and Duration. The dashboard is defined in the class Ens.DeepSee.ActivityVolumeAndDurationDashboard Opens in a new tab.
The dashboard displays current activity information for each production configuration item.
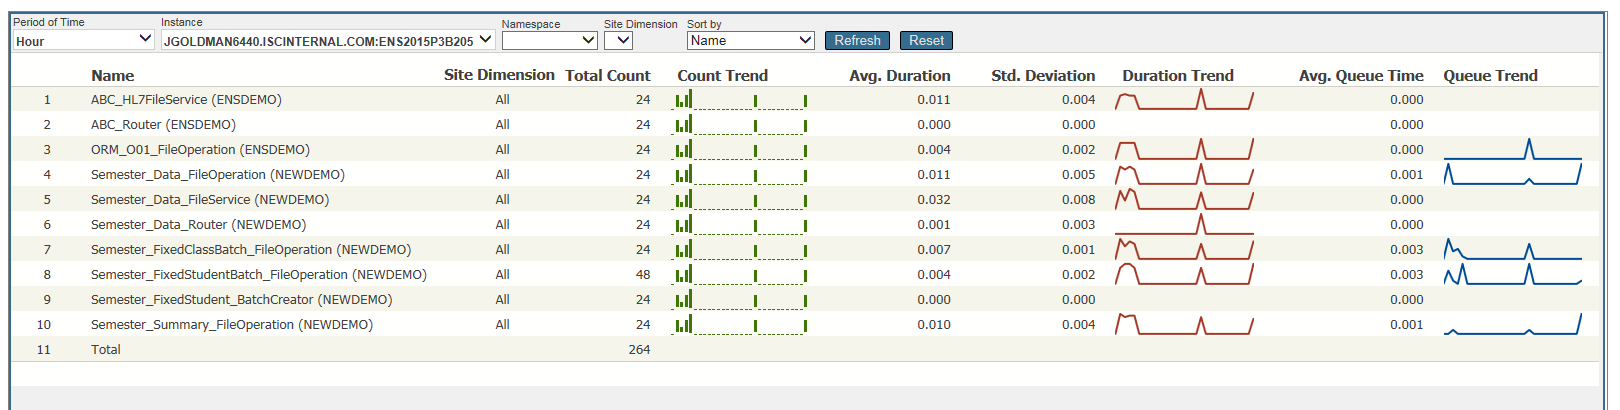
You can select the statistics to display by time period, instance, namespace, and site dimension:
-
Period of Time—After selecting the time period, select the check mark to set it. The options are:
-
Minute—displays the activity in the previous minute.
-
Hour—displays the activity in the previous hour.
-
Day—displays the activity in the previous day.
-
Week—displays the activity in the previous week.
-
Month—displays the activity in the previous month.
-
Year—display the activity in the previous year.
-
All—displays all the stored statistics.
-
-
Instance—You can select the instance of Ensemble that you want to view the activity. If you select the instance, then the instance name is not included in the name column. This reduces the width of the table and helps it fit on the screen. After selecting the instance, select the check mark to set it.
Note:The DeepSee dashboard user interface supports the ability to display statistics from multiple instances of Ensemble, but the mechanism to gather statistics from multiple instances is experimental and should not be used in production environments.
-
Namespace—You can select the namespace that you want to view the activity. If you filter on a namespace, then the namespace does not appear in the name column, reducing the width of the display.
-
Site Dimension—Custom property set by code. See the RecordStats()Opens in a new tab method or to the SetStatsUserDimension()Opens in a new tab method for information on setting the site dimension.
You can sort the statistics by: Name, Total Count, Avg. Duration, or Avg. Queue Time.
The dashboard automatically refreshes every 60 seconds. You can also refresh it by selecting Refresh. The Reset button resets the selection fields to their initial default values.
For each configuration item reporting statistics, the dashboard displays the following information:
-
Name—The configuration item name in the production. The instance and namespace are included in parentheses. If you have filtered activity based on instance or namespace, that item is omitted.
-
Site Dimension—Identifying information that can be included by custom code. If you filter by the site dimension, this column displays the site dimension value. Otherwise it displays “All”.
-
Total Count—Total number of messages during the specified time period.
-
Count Trend—Graphic representation of the count within the specified time period. For example, if the time period is a week, the graph shows the count for each day in the week.
-
Average Duration—Average time to process the message in the component.
-
Standard Deviation—Standard deviation on the times needed to process the message in the component.
-
Duration Trend—Graphic representation of the average duration within the specified time period.
-
Average Queue Time—Average time message remained on the queue during the specified time period.
-
Queue Trend—Graphic representation of the average queue wait time within the specified time period.
Although this dashboard can only display activity for the previous minute, hour, day, week, month, or year, you can design your own dashboard with more flexibility. For example, you could create a dashboard that displays the activity from 9AM to 6PM for a specified day.
Writing Custom Code to Record Activity
In addition to using the built-in statistics mechanism, you can write custom code to:
-
Fill in the site dimension field of the recorded statistics. This allows you to provide additional information in the statistics.
-
Explicitly record custom statistics to be stored in the database. In this case, you don’t activate statistics for the component. You are using the mechanism that aggregates the data and transfers the statistics data from the temporary storage to the permanently stored database.
To specify the site dimension to be recorded with the statistics, use the SetStatsUserDimension()Opens in a new tab method. For example, the following code first checks that statistics are enabled and then it sets the site dimension to “CriticalAction”.
 If ##class(Ens.Util.Statistics).StatsStarted(..%ConfigName) {
  Do ##class(Ens.Util.Statistics).SetStatsUserDimension(..%ConfigName,"CriticalAction")
 }
The RecordStats()Opens in a new tab method writes the specified statistics data to the temporary storage. The data will be aggregated to the three tables. Consider the following example:
Do ##class(Ens.Util.Statistics).RecordStats(0,"IncomingMsgSrvc","ActiveMsgs",1,4087,35)
The parameters have the following meaning:
-
0—specifies the unknown host type.
-
"IncomingMsgSrvc"—used as the configuration item name. This does not have to match the component’s configuration item name.
-
”ActiveMsgs”—used for the site dimension.
-
1—specifies to release temporary memory after writing the statistics.
-
4087—specifies that 4087 messages were processed.
-
35—specifies a total duration for the messages of 35 seconds.
Accessing the Activity Monitor Database
The activity statistics are stored in these three tables. The three tables contain the data about the same activity, but using a different time period to aggregate the data. The three tables are:
-
Ens_Activity_Data.Seconds—aggregates activity over 10-second intervals.
-
Ens_Activity_Data.Hours—aggregates activity over 1-hour intervals.
-
Ens_Activity_Data.Days—aggregates activity over 1-day intervals.
This redundancy in storage provides the flexibility to minimize the long-term storage required for the statistics without losing the ability to examine historic data. For example, you can use the Ens_Activity_Data.Seconds table to closely examine activity over the previous two days but purge data after two days to minimize storage. The Ens_Activity_Data.Hours and Ens_Activity_Data.Days tables store less data and can be purged much less frequently. You can use the Ens_Activity_Data.Hours table to examine how activity changes over the course of a day. For example, you could use it to generate a report of the peak activity periods during each day of the week and the impact it has on delays and queue sizes.
Purging the Activity Monitor Database
Although the tables storing the activity statistics data are much smaller than the total size of the corresponding messages, you should purge the activity statistics tables on a regular basis. TheEns.Util.Tasks.PurgeActivityDataOpens in a new tab task purges the specified activity table. You specify the amount of data to keep by specifying a number and a time unit. For example, you could retain 7 days of data for the Seconds table, 12 months of data for the Hours table, and 3 years of data for the Days table.
For details on how to create a task, see “Using the Task Manager” in Managing Caché.