Configuring Zen Reports for Excel Spreadsheet Output
Configuring Zen Reports for Excel Spreadsheet Output
You can use Zen reports to generate an Excel spreadsheet from data in a Caché database. You need to instruct Zen reports to generate an Excel spreadsheet by setting the parameter DEFAULTMODE to "excel", or setting the URI query parameter $MODE=excel. You must have Excel 2003 or later installed on your computer, or have a plugin or program registered to read the Microsoft XML file format for Office 2003. You must also have a Java Virtual Machine (JVM) and Java Developers Kit (JDK) version 1.7 or later installed.
If you are using Office 2007 or Office 2010, you should set DEFAULTMODE to "xlsx", or set the URI query parameter $MODE=xlsx. This value instructs Zen reports to generate a spreadsheet using the Excel xlsx format, which is native to Office 2007 and Office 2010.
Even though you are not using the ReportDisplay block for report output, it must be defined, and the name attribute must be identical to the name attribute in the ReportDefinition.
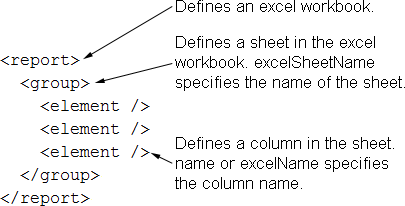
In order to generate an Excel spread sheet, the ReportDefinition block must have a very specific structure. Zen reports uses elements in the ReportDefinition to generate XML, then uses that XML to generate the Excel spread sheet. The following figure shows how elements in the ReportDefinition map to components of the Excel spread sheet. Following sections illustrate this process in more detail.
Starting with Caché version 2015.1, Zen reports supports setting DEFAULTMODE to "displayxlsx". This mode enables you to use the ReportDisplay block to convert the output of an arbitrary ReportDefinition block into XML appropriate to generate an Excel spread sheet. See Generating Excel Spread Sheets from Arbitrary XML.
The following list summarizes the available modes for Excel spread sheet generation:
-
excel – for Excel 2003 or later, but prior to Office 2007 and Office 2010.
-
xlsx – for Office 2007 and Office 2010.
-
displayxlsx – for Office 2007 and Office 2010 when the ReportDefinition output is not in the required format.
Including Data in the Spreadsheet
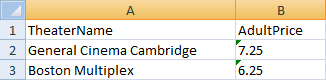
By default, only data in <element> elements is used in the spreadsheet. The following <report> block uses <element> for TheaterName and AdultPrice, but <attribute> for ChildPrice:
<report xmlns="http://www.intersystems.com/zen/report/definition"
    name="ReportExample"
    sql="Select Top 2 TheaterName, AdultPrice, ChildPrice from Cinema.Theater">
  <group name="Theater">
   <element name="TheaterName" field="TheaterName" />
   <element name="AdultPrice" field="AdultPrice" />
   <attribute name="ChildPrice" field="ChildPrice" />
  </group>
 </report>
It generates the following XML:
<ReportExample>
  <Theater ChildPrice="5.75">
    <TheaterName>General Cinema Cambridge</TheaterName>
    <AdultPrice>7.25</AdultPrice>
  </Theater>
  <Theater ChildPrice="4.75">
     <TheaterName>Boston Multiplex</TheaterName>
    <AdultPrice>6.25</AdultPrice>
  </Theater>
</ReportExample>
Which produces the following Excel spreadsheet. Note that only values from <element> elements appear in the spreadsheet.
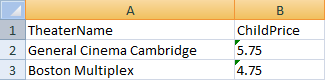
The class parameter EXCELMODE determines whether values in the spreadsheet come from <element> or <attribute> elements. The default value is "element". If you set EXCELMODE = "attribute", this <report> block:
<report
 xmlns="http://www.intersystems.com/zen/report/definition"
 name="ReportExample"
 sql="Select Top 10 TheaterName, AdultPrice, ChildPrice from Cinema.Theater">
  <group name="Theater">
    <attribute name="TheaterName" field="TheaterName" />
    <element name="AdultPrice" field="AdultPrice" />
    <attribute name="ChildPrice" field="ChildPrice" />
  </group>
</report>
Generates the following XML:
<ReportExample>
  <Theater TheaterName="General Cinema Cambridge" ChildPrice="5.75">
    <AdultPrice>7.25</AdultPrice>
  </Theater>
  <Theater TheaterName="Boston Multiplex" ChildPrice="4.75">
    <AdultPrice>6.25</AdultPrice>
  </Theater>
</ReportExample>
Which produces the following Excel spreadsheet. Note that only values from <attribute> elements appear in the spreadsheet.
Use of EXCELMODE = "attribute" is not recommended, because it is inflexible and unable to carry Excel metadata. For instance, because you cannot specify isExcelNumber or isExcelDate on an attribute, all data is treated as text. This can cause aggregates to malfunction if Excel is attempting to perform arithmetic operations on text. In addition, under some circumstances, columns appear in the spreadsheet in attribute name alphabetical order, rather than in the order specified in the report. This can lead to a mismatch with aggregates if the aggregates are not organized in the same alphabetical order as the attributes. The relevant circumstances are:
-
If mode = "excel" and EXCELMULTISHEET is its default value of 0, then EXCELMODE = "attribute" produces columns from attributes in the order specified in the XML, not alphabetically.
-
If mode = "xlsx" or EXCELMULTISHEET is 1, then EXCELMODE = "attribute" produces columns from attributes in attribute name alphabetical order.
Numbers, Dates and Aggregates
In the examples provided in the previous section, numeric values are interpreted as text in both Excel spreadsheets. Zen reports also enables you to instruct Excel to interpret a value as a number, date, or time. This feature is available only when EXCELMODE = "element".
Zen reports supports number, date and time values in Excel spreadsheets in two ways, depending on whether you are generating the spreadsheet in excel (Excel 2003) or xlsx (Excel 2007 and 2010) mode. In excel mode, You can use isExcelNumber, isExcelDate or isExcelTime to specify that the value supplied by an <element> should be treated as a number, date or time in the spreadsheet. For spreadsheets generated in xlsx mode, Zen reports also lets you provide additional formatting information with excelNumberFormat.
If the runtimeMode of the group that contains the time element is 1 (ODBC) or 2 (display), the time expression needs to be in display format, for example $ztime($P($h,",",2)). If the runtimeMode is 0 (logical), the time expressions needs to be in logical format, for example, $P($h,",",2).
The supported number, date and time formats used with excelNumberFormat are taken from the ISO standard that defines the Microsoft Excel file format, as described in the document c051463_ISOIEC 29500-1_2008(E).pdf. You can find this document at:
http://standards.iso.org/ittf/PubliclyAvailableStandards/index.htmlOpens in a new tab
Search for 29500, part 1.
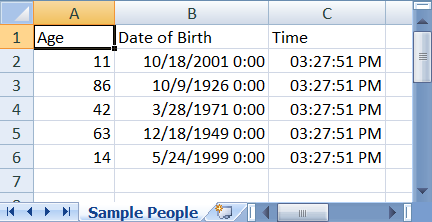
The following example produces a spreadsheet in excel mode that contains numbers, dates, and times.
<report xmlns="http://www.intersystems.com/zen/report/definition"
 name="MyReport" runonce="true" >
 <group name="Persons"
  sql="SELECT top 5 name,Home_City as city,age,dob from Sample.Person
  order by Home_City" runtimeMode="1"
  excelSheetName="Sample People" >
  <group name="Person" >
   <element field="age" name="age" excelName="Age"
    isExcelNumber="true"/>
   <element field="dob" name="dob" excelName="Date of Birth"
    isExcelDate="true"/>
   <element name="time"
    expression='$ztime($P($h,",",2))' excelName="Time"
    isExcelTime="true"/>
  </group>
 </group>
</report>
It produces the following output in Excel:
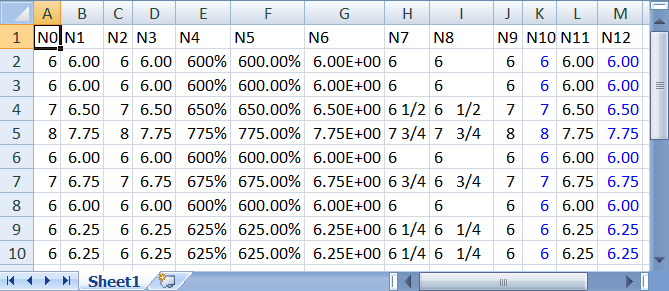
The next example illustrates several number formats supported in xlsx mode:
<report xmlns="http://www.intersystems.com/zen/report/definition"
 name="MyReport" runonce="true" >
 <group name="Cinemas"
  sql="SELECT top 10 TheaterName,AdultPrice,ChildPrice from
  Cinema.Theater order by TheaterName" >
  <group name="Cinema">
   <element field="AdultPrice" excelName="N0"
    isExcelNumber="true" excelNumberFormat="0"/>
   <element field="AdultPrice" excelName="N1"
    isExcelNumber="true" excelNumberFormat="0.00"/>
   <element field="AdultPrice" excelName="N2"
    isExcelNumber="true" excelNumberFormat="#,##0"/>
   <element field="AdultPrice" excelName="N3"
    isExcelNumber="true" excelNumberFormat="#,##0.00"/>
   <element field="AdultPrice" excelName="N4"
    isExcelNumber="true" excelNumberFormat="0%"/>
   <element field="AdultPrice" excelName="N5"
    isExcelNumber="true" excelNumberFormat="0.00%"/>
   <element field="AdultPrice" excelName="N6"
    isExcelNumber="true" excelNumberFormat="0.00E+00"/>
   <element field="AdultPrice" excelName="N7"
    isExcelNumber="true" excelNumberFormat="# ?/?"/>
   <element field="AdultPrice" excelName="N8"
    isExcelNumber="true" excelNumberFormat="# ??/??"/>
   <element field="AdultPrice" excelName="N9"
    isExcelNumber="true" excelNumberFormat="#,##0 ;(#,##0)"/>
   <element field="AdultPrice" excelName="N10"
    isExcelNumber="true" excelNumberFormat="[Blue]#,##0 ;[Red](#,##0)"/>
   <element field="AdultPrice" excelName="N11"
    isExcelNumber="true" excelNumberFormat="#,##0.00;(#,##0.00)"/>
   <element field="AdultPrice" excelName="N12"
    isExcelNumber="true" excelNumberFormat="[Blue]#,##0.00;[Red](#,##0.00)"/>
  </group>
 </group>
</report>
It produces the following output:
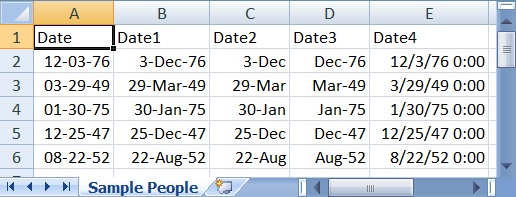
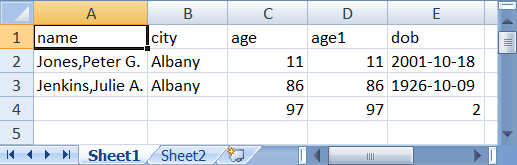
The following example shows several different date formats supported in xlsx mode.
<report xmlns="http://www.intersystems.com/zen/report/definition"
 name="MyReport" runonce="true" >
 <group name="Persons"
  sql="SELECT top 5 name,Home_City as city,age,dob from Sample.Person"
  runtimeMode="1" excelSheetName="Sample People" >
  <group name="Person" >
   <element field="dob" excelName="Date"
    isExcelDate="true" excelNumberFormat="mm-dd-yy"/>
   <element field="dob" excelName="Date1"
    isExcelDate="true" excelNumberFormat="d-mmm-yy"/>
   <element field="dob" excelName="Date2"
    isExcelDate="true" excelNumberFormat="d-mmm"/>
   <element field="dob" excelName="Date3"
    isExcelDate="true" excelNumberFormat="mmm-yy"/>
   <element field="dob" excelName="Date4"
    isExcelDate="true" excelNumberFormat="m/d/yy h:mm"/>
  </group>
 </group>
</report>
It produces the following output in Excel:
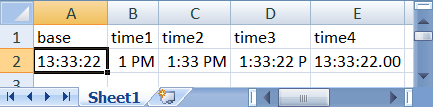
The following example shows several different time formats supported in xlsx mode.
<report xmlns="http://www.intersystems.com/zen/report/definition"
 name="MyReport" runonce="true">
 <group name="Time">
  <group name="TimeFormats">
   <element name="base" expression='$ztime($P($h,",",2))'/>
   <element name="time1" expression='$ztime($P($h,",",2))'
       isExcelTime="true" excelNumberFormat="h AM/PM" />
   <element name="time2" expression='$ztime($P($h,",",2))'
       isExcelTime="true" excelNumberFormat="h:mm AM/PM" />
   <element name="time3" expression='$ztime($P($h,",",2))'
       isExcelTime="true" excelNumberFormat="h:mm:ss A/P" />
   <element name="time4" expression='$ztime($P($h,",",2))'
       isExcelTime="true" excelNumberFormat="h:mm:ss.00" />
  </group>
 </group>
</report>
It produces the following output in Excel:
Aggregates
If you set the class parameter AGGREGATETAG, you can also add aggregates to the spreadsheet. A popular value for AGGREGATETAG is "aggregate", but you can use any value that is a valid name for an XML attribute. The value of AGGREGATETAG is used to create an attribute in the generated XML that identifies items as coming from an <aggregate> element in the report. The attribute excelFormula specifies that the value supplied by this aggregate should be an Excel formula in the spreadsheet. excelFormula must be an Excel formula that matches the value of the type attribute for the <aggregate>. The Excel formulas you can generate are limited to those equivalent to the computations you can specify with the aggregate type attribute, see <aggregate>.
Aggregates also support excelNumberFormat for xlsx mode.
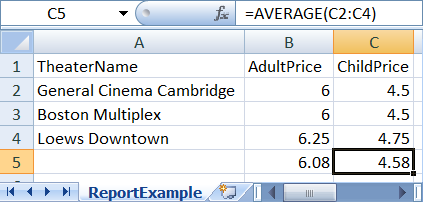
When using aggregates, you must provide an <aggregate> element for each column in the generated Excel spreadsheet. You can set type="PLACEHOLDER" in <aggregate> elements where you do not wish to calculate an aggregate. With AGGREGATETAG="aggregate", the following <report> block generates an Excel spreadsheet in xlsx mode that treats the values for AdultPrice and ChildPrice as numbers, and includes formulas to average those columns.
<report xmlns="http://www.intersystems.com/zen/report/definition"
  name="ReportExample"
  sql="Select Top 3 TheaterName, AdultPrice, ChildPrice from Cinema.Theater">
 <group name="Theater">
  <element name="TheaterName" field="TheaterName"/>
  <element name="AdultPrice" field="AdultPrice" isExcelNumber="true"/>
  <element name="ChildPrice" field="ChildPrice" isExcelNumber="true"/>
 </group>
 <aggregate type="PLACEHOLDER" />
 <aggregate field="AdultPrice" type="AVG" excelFormula="AVERAGE"
  excelNumberFormat="0.00"/>
 <aggregate field="ChildPrice" type="AVG" excelFormula="AVERAGE"
  excelNumberFormat="0.00"/>
</report>
The following is the XML generated by the preceding report. Note that isExcelNumber="true" in the report generates isExcelNumber="1" in the XML. The attribute aggregate="1" marks the items as aggregates, and the attribute excelFormula specifies the formula to use in the generated spreadsheet.
<ReportExample>
  <Theater>
    <TheaterName isExcelNumber="0">General Cinema Cambridge</TheaterName>
    <AdultPrice isExcelNumber="1">7.25</AdultPrice>
    <ChildPrice isExcelNumber="1">5.75</ChildPrice>
  </Theater>
  <Theater>
  <TheaterName isExcelNumber="0">Boston Multiplex</TheaterName>
    <AdultPrice isExcelNumber="1">6.25</AdultPrice>
    <ChildPrice isExcelNumber="1">4.75</ChildPrice>
  </Theater>
  <Theater>
    <TheaterName isExcelNumber="0">Loews Downtown</TheaterName>
    <AdultPrice isExcelNumber="1">7.50</AdultPrice>
    <ChildPrice isExcelNumber="1">6.00</ChildPrice>
  </Theater>
  <item aggregate="1" placeholder="1"/>
  <item aggregate="1" excelFormula="AVERAGE"
   excelNumberFormat="0.00">6.083333333333333333</item>
  <item aggregate="1" excelFormula="AVERAGE"
   excelNumberFormat="0.00">4.583333333333333333</item>
</ReportExample>
The following image shows the resulting Excel spreadsheet, with the formula visible for the average ChildPrice.
Multi-sheet Reports
You can create multiple Excel worksheets from a single Zen reports class. When you set the class parameter EXCELMULTISHEET to 1, Zen uses each group that is a direct child of <report> to create a worksheet in the Excel spreadsheet. The content of each group must create a valid Excel worksheet.
Zen reports does not support XSLTMODE="browser" or $XSLT=browser when EXCELMULTISHEET is 1. The reason is that export of the report to Excel is done primarily by an external Java program. Temporary files generated during export of a multiple-worksheet report are stored in the report's REPORTDIR. If REPORTDIR is null, they are stored where Caché keeps temporary files, which is C:\MyCache\Mgr\Temp by default. See the section “Setting a File Name for Intermediate and Final Files”.
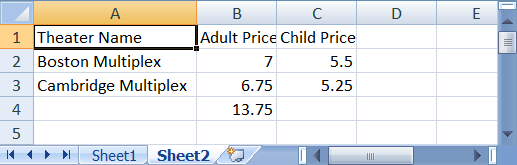
By default, Zen reports follows the excel convention of naming multiple worksheets Sheet1, Sheet2, and so forth. For example, with EXCELMULTISHEET=1, the following <report> block generates an Excel spreadsheet containing two worksheets, named Sheet1, and Sheet2:
<report xmlns="http://www.intersystems.com/zen/report/definition"
     name="MyReport" runonce="true">
  <group name="Persons"
    sql="SELECT top 2 name,Home_City as city,age,dob from Sample.Person order by Home_City"
    runtimeMode="1">
    <group name="Person">
      <element field="name" name="name"/>
      <element field="city" name="city"/>
      <element field="age" name="age" isExcelNumber="true"/>
      <element field="age" name="age1" isExcelNumber="true"/>
      <element field="dob" name="dob" isExcelDate="1"/>
    </group>
    <aggregate type="PLACEHOLDER" excelName="A1"/>
    <aggregate name="city" field="city" type="CUSTOM"
      class="%ZEN.Report.Aggregate.CountDistinct" excelName="A2"/>
    <aggregate field="age" type="SUM" excelFormula="SUM" excelName="A3"/>
    <aggregate field="age" type="SUM" excelFormula="SUM" excelName="A4"/>
    <aggregate type="PLACEHOLDER" excelName="A5"/>
  </group>
  <group name="Cinemas"
    sql="SELECT top 2 TheaterName,AdultPrice,ChildPrice from Cinema.Theater order by TheaterName">
    <group name="Cinema">
      <element field="TheaterName" name="TheaterName" excelName="Theater Name"/>
      <element field="AdultPrice" name="AdultPrice" isExcelNumber="true" excelName="Adult Price"/>
      <element field="ChildPrice" name="ChildPrice" isExcelNumber="true" excelName="Child Price"/>
    </group>
    <aggregate type="PLACEHOLDER"/>
    <aggregate name="TotalAdultPrice" field="AdultPrice" type="SUM" excelFormula="SUM"/>
  </group>
</report>
The following images show the two resulting worksheets in the Excel spreadsheet.
You can use the property excelSheetName on <report> or <group> to specify a name for the excel worksheet.
<report xmlns="http://www.intersystems.com/zen/report/definition"
name='myReport'
sql="SELECT ID,Customer,Num,SalesRep,SaleDate
FROM ZENApp_Report.Invoice
WHERE (Month(SaleDate) = ?) OR (? IS NULL)
ORDER BY SalesRep,SaleDate">
<parameter expression='..Month'/>
<parameter expression='..Month'/>
<group name='SalesRep' breakOnField='SalesRep'
excelSheetName="SalesRep">
<group name="record">
<element name='salesrep' field="SalesRep" excelName="Sales Rep"/>
<element name='id' field='ID' isExcelNumber="true"/>
<element name='number' field='Num'
isExcelNumber="true" excelName="Amount"/>
<element name='date' field='SaleDate'
isExcelDate="true" excelName="Date of Sale"/>
<element name='customer' field='Customer' excelName="Customer"/>
</group>
</group>
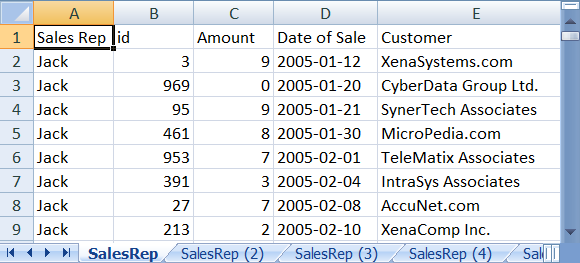
</report>The following image shows the first four of the six generated worksheets. Note that the report sets the value of excelSheetName on the group that is an immediate child of <report>. That value is used in generating sequential names for the worksheets.
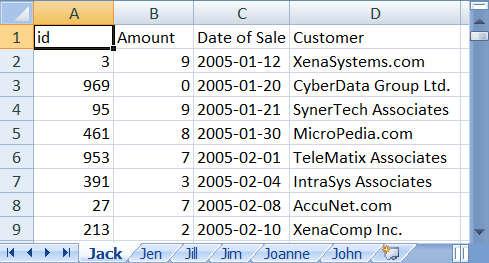
You can also use a runtime expression as the value of excelSheetName. The next example uses that feature to use the names of the sales reps to name the sheet containing their sales information:
<report xmlns="http://www.intersystems.com/zen/report/definition"
name='myReport'
sql="SELECT ID,Customer,Num,SalesRep,SaleDate
 FROM ZENApp_Report.Invoice
 WHERE (Month(SaleDate) = ?) OR (? IS NULL)
 ORDER BY SalesRep,SaleDate">
 <parameter expression='..Month'/>
 <parameter expression='..Month'/>

  <group name='SalesRep' breakOnField='SalesRep'
   excelSheetName='!..GetName()'>
   <group name="record">
   <element name='salesrep' field="SalesRep" excelName="Sales Rep"/>
   <element name='id' field='ID' isExcelNumber="true"/>
   <element name='number' field='Num'
    isExcelNumber="true" excelName="Amount"/>
   <element name='date' field='SaleDate'
    isExcelDate="true" excelName="Date of Sale"/>
   <element name='customer' field='Customer' excelName="Customer"/>
  </group>
 </group>
</report>
This report requires the following method:
Method GetName()
 {
  quit %val("SalesRep")
 }
It produces the following report, with each worksheet named for the corresponding sales rep.
If you need further control over the way sheet names are generated, you can override the method %getUniqueExcelSheetName. The following code sample shows the method as it is defined in %ZEN.Report.reportPageOpens in a new tab.
Method %getUniqueExcelSheetName(excelSheetName As %String) As %String
{
 Set count=$i(%excelSheetNames(excelSheetName))
 if count>1 {
  quit excelSheetName_" ("_count_")"
 }
 else
 {
  quit excelSheetName
 }
}
Generating Excel Spread Sheets from Arbitrary XML
Prior to Caché version 2015.1, Excel spread sheets could be generated only from a report having a ReportDefinition block with a specific structure, which generated XML suitable for conversion into a spread sheet. With version 2015.1 and higher, you can use the ReportDisplay block to convert the XML output of an arbitrary ReportDefinition block into the structure required to generate an Excel spread sheet. The following figure shows how elements in the ReportDisplay map to components of the spread sheet.
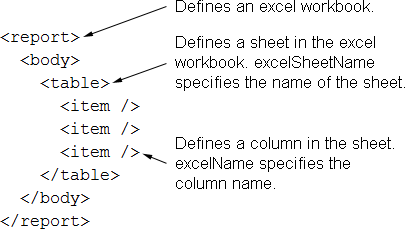
Each table in the ReportDisplay corresponds to a sheet in the Excel workbook. Tables cannot be nested. The parameter EXCELMULTISHEET is ignored in displayxlsx mode. The <item> element supports the attributes isExcelNumber and excelNumberFormat. These attributes are used like the similarly-named attributes in the ReportDefinition to control interpretation of the output in Excel. The <table> element uses the attribute excelSheetName to supply a name for the corresponding sheet in the spread sheet.
When generating Excel output in displayxlsx mode, dates must be in Excel format. You need to call the ToExcelDate method to convert dates in $HORLOG format to the Excel date format. Convert from other date formats to Excel date format by first converting to $HORLOG format and then calling ToExcelDate.
The following code sample shows a ReportDefinition that generates XML.
<report
xmlns="http://www.intersystems.com/zen/report/definition"
name="MyReport" runonce="true">
<group name="Persons"
sql="SELECT top 10 name,age from Sample.Person "
runtimeMode="1" >
<group name="Person" >
<attribute name="name" field="Name"/>
<attribute name="age" field="Age"/>
</group>
</group>
<aggregate name="avgage" field="Age" type="AVG"/>
<group name="Cinemas"
sql="SELECT TheaterName,AdultPrice,ChildPrice
from Cinema.Theater order by TheaterName" >
<group name="Cinema">
<element field="TheaterName" name="TheaterName" />
<element field="AdultPrice" name="AdultPrice" />
<element field="ChildPrice" name="ChildPrice" />
</group>
<aggregate name="TotalAdultPrice"
field="AdultPrice" type="SUM" />
</group>
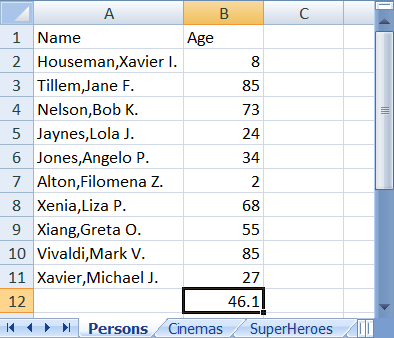
</report>The next sample shows a ReportDisplay that configures the XML for Excel report generation. Note that it references the ReportDefinition groups “Persons/Person” and “Cinemas/Cinema”, and generates additional XML in the ReportDisplay.
<report
xmlns="http://www.intersystems.com/zen/report/display"
name="MyReport">
<body>
<table group="Persons/Person" excelSheetName="Persons"
width="100%" oldSummary="false">
<item field="@name" excelName="Name" width="25%"/>
<item field="@age" isExcelNumber="true"
excelName="Age" width="10%">
<summary value=" " isExcelAggregate="true" />
<summary field="avgage"
formatNumber='###,###,##0.00;(#)'
isExcelAggregate="true"
excelFormula="AVERAGE"/>
</item>
</table>
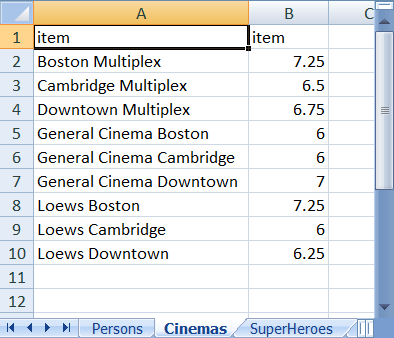
<table group="Cinemas/Cinema"
excelSheetName="Cinemas" >
<item field="TheaterName"/>
<item field="AdultPrice" isExcelNumber="true"/>
</table>
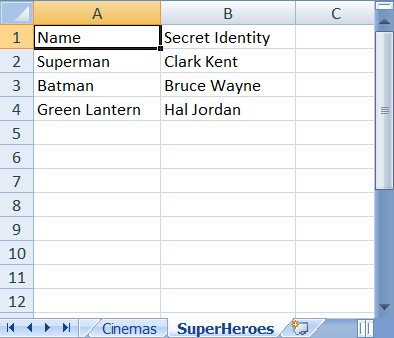
<table staticTable="true"
excelSheetName="SuperHeroes" >
<tr>
<item value="Superman" excelName="Name"/>
<item value="Clark Kent" excelName="Secret Identity"/>
</tr>
<tr>
<item value="Batman" excelName="Name"/>
<item value="Bruce Wayne" excelName="Secret Identity"/>
</tr>
<tr>
<item value="Green Lantern" excelName="Name"/>
<item value="Hal Jordan" excelName="Secret Identity"/>
</tr>
</table>
</body>
</report>The following three figures show the Excel output.
The Excel Server
Zen reports provides Excel Server capability to improve performance when creating Excel spread sheets. The Excel Server is a Java Virtual Machine process which runs in the background and creates Zen report Excel output. By running as a background process, the Excel Server eliminates the overhead of starting the Java Virtual Machine.
The Management Portal Excel Servers page (System Administration > Configuration > Zen Reports > Excel Servers) lists currently configured Excel Servers. When Caché is first installed, there are no Excel Servers configured. If you have configured an Excel Server, it starts automatically when you create a report as an Excel spread sheet.
Creating a Excel Server
The New Excel Server button opens the New Zen Report Excel Server page, which lets you configure a new Excel Server. The first three fields are required, the remaining fields are optional.
-
Name: A unique name for the Excel Server.
-
Port: The TCP port that the Excel Server uses to receive reports.
-
Ping Port: The TCP port that the Excel Server uses for all other communication, such as status queries and shutdown requests.
-
Num Threads: If the Excel Server is using multi-threaded Java, this field supplies the number of threads used by the Excel Server for report rendering.
-
Num Ping Threads: If the Excel Server is using multi-threaded Java, this field supplies the number of threads used by the Excel Server for other communication.
-
Log Level: Standard Java parameters to control logging. If you choose to enable logging, the following three items appear on the form:
-
Log File: By default, the Excel Server log file is created in your home directory. You can specify an alternate location here. On Unix systems, in order to avoid privilege issues, specify a location where the user has appropriate permissions.
Each time you stop and restart the Excel Server, it begins a new log file. The Excel Server also starts a new log file when the file size exceeds the limit set by Max. File Size. The log file names have a numeric suffix. The file ending in .0 is the most recent, and as new files are created, the previous ones are renamed with larger suffix numbers, until the number of files reaches the limit set by Rotation Count. Then the names recycled and older information is lost. This field supplies the path and base file name of the log file.
If you configure more than one Excel Server, providing log file names makes it easy for you to match log files with the Excel Server that created them.
-
Max. File Size: Maximum size of the Excel Server log file. The Excel Server creates a new log file when the size of the current log file reaches this limit.
-
Rotation Count: The maximum number of log files. The Excel Server recycles file names, losing older information, when the number of log files reaches this limit.
-
-
Initialization Timeout: The amount of time in seconds that Zen reports waits for the Excel Server to start up. An error occurs if the Excel Server fails to start in this time.
-
Connection Timeout: The amount of time in seconds that Zen reports waits for the Excel Server to connect when rendering a report. You normally expect connection to take less time than initialization. An error occurs if the Excel Server fails to connect in this time.
Use the Save button to save your changes, or the Cancel button to return to the Zen Report Excel Servers page. Once you have saved your changes, you see that the new Excel Server has been added to the list.
Managing the Excel Server
The Manage button, which is located to the right of each listing on the Excel Servers page (System Administration > Configuration > Zen Reports > Excel Servers), lets you edit values and perform additional tasks:
-
Delete: Removes the Excel Server. You cannot edit or delete a Excel Server while it is running.
-
Start: Starts the Excel Server. Asks for confirmation and provides some information on its status. Note that the Excel Server starts automatically when you generate a report using the Excel Server port.
-
Stop: Stops the Excel Server. Asks for confirmation and provides some information on its status.
-
Verify: Checks status of ports assigned to the Excel Server. You expect the ports to be in use if the Excel Server is running, and not in use if it is not.
-
Activity: Summarizes activity on this Excel Server since the last shutdown.
-
Log: Opens the log file. Maximum file size displayed in the browser is 1 megabyte, and files larger than this limit are truncated.
In your Zen report you can set the EXCELSERVER class parameter or the ExcelServer property to the port the Excel Server is listening on. Then load the page with the mode set to excel. You can also set EXCELSERVER class parameter for an entire Zen Application.
The Zen report property ExcelServerTimeOut controls the length of time the report waits for the Excel Server before timing out. A positive integer specifies the number of seconds to wait before timing out. A value of 0 means timeout immediately, and a value of –1 means never timeout. You can also pass the timeout interval in the URL using $EXCELSERVERTIMEOUT. The default value is null ("" in Caché), which means never timeout.
Communicating with the Excel Server
The class %ZEN.Report.PingOpens in a new tab provides the ping method that you can use to communicate with the Excel Server.
In addition to the port and server type, ping returns the maximum memory available, the committed memory, and the amount of memory used. The Excel Server attempts to use the Java tenured generation pool to get information about memory and return this information to ping. If the Excel Server cannot find the Java tenured generation pool, it returns a blank string ("") for the value of maximum memory and used memory.
The ping method also returns the runtime name in the form pid@hostname. You can use $PIECE to process the string and get the process id.
The following example shows how to use ping:
 set Status=##class(%ZEN.Report.Ping).ping("1234",30,.port,.servertype,.memMax,.memCommitted,.memUse,.runtimeName)
 write !,"port="_port
 write !,"servertype="_servertype
 write !,"memMax="_memMax
 write !,"memCommitted="_memCommitted
 write !,"memUse="_memUse
 write !,"runtimeName="_runtimeName